Connector Series - Q4 2021
Update on Events affecting Liner Shipping in, from and to New Zealand
In general, the effects of the Covid-19 pandemic remain the main factors still disrupting global supply chains. In our previous Connector series, we informed you about the various influencing factors and impacts and these continue to substantially affect the transportation of goods around the world. You can find our recent editions here.
In this Connector, we elaborate further on worldwide port congestion, the subsequent reducing service offering connecting New Zealand to the world, and the development of rates for container shipping services.
Congestion
To start on a positive note, we have seen an improvement in the operational landscape of New Zealand in recent months. The Ports of Auckland, having been at the center of the delays of shipping services in New Zealand, have improved their operations. While the automation project has been delayed further and most berth windows remain suspended, we have seen a lessening in vessel delays along the NZ coast as a positive consequence.
The current restrictions due to the Covid-19 delta variant outbreak and the subsequent lockdown measures, however, have adversely impacted operations in the whole country. From a New Zealand export perspective, the dairy season is currently putting additional pressure on the available capacity ex Aotearoa, plus the global pre-Christmas peak season has added additional volume peaks to the already greatly constrained trade routes.
The massive congestion that we see affecting the global supply chain has in recent months increased further and is reportedly at an all-time high. According to Sea-Intelligence, 12.5% of the worldwide containerized fleet was waiting offshore to enter the world’s congested ports. Expressed in TEU figures, this would translate into approximately 3 Million TEU nominal vessel capacity, which is nearly as much as CMA CGMs, the world’s third-largest container line, entire fleet of more than 500 vessels.
While many regions in the world are affected, the situation in certain areas draws a dramatic picture. Various South-East Asian and Chinese ports, large parts of the Indian Subcontinent and Pakistan as well as the Middle East and the East and West coasts of North and South America, for example, have presented as areas of major concern. Either through direct congestion in the ports themselves or affected by heavily congested transshipment hubs – or both. Services from New Zealand to several ports in these areas have become largely impossible as shipping lines seek to let the congestion subside or alternatively are only possible at unprecedented rate levels.
The main area of concern on a global scale is the situation in the United States. US consumer demand and increasing freight rates have been fuelling the move of shipping assets (vessels and containers) to service the US import market. This has resulted in a reduction in shipping capacity in other trade lanes and congestion in US ports and landside networks.
In our previous Connector series, we have referred to the situation on the US West Coast, where vessels were lining up to wait for access into heavily congested ports like Long Beach or Los Angeles. This situation has since deteriorated further, with as many as 73 containerships waiting more than two weeks to enter these ports at the end of September, according to Marine Exchange of Southern California. While the number of waiting ships has reduced a little lately, with between 50-60 vessels waiting to be moored and worked, the waiting time in and around San Pedro Bay has increased to over four weeks.
Congestion in Long Beach and Los Angeles, 3 day-rolling average, offshore/docked
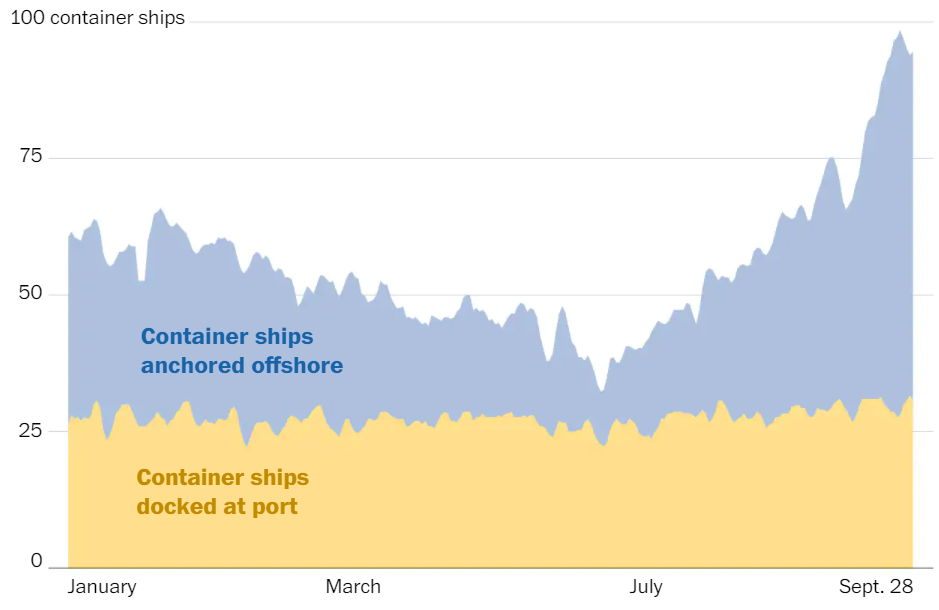
Source: The Washington Post, Marine Exchange of Southern California
United States leading media like the Washington Post speak of “an import avalanche that has overwhelmed freight channels”, as a reason for the congestion, triggered by the Covid-19 induced shift in spending from services to goods that we have described in our recent Connector. The situation has been exasperated further through weaknesses in the nation’s ports and hinterland infrastructure as well as lacking supply chain resilience. One example would be the availability of trucks and truck drivers to ensure a continuous flow out of the ports. According to one report, in Los Angeles, there are currently 16 containers waiting for every available truck. To put this avalanche of imports into context the Port of Los Angeles in its latest Cargo News Briefing reported that year-to-date August 2021 close to 3.8 Million laden TEU were imported through the port, around 31% more than in the same period in 2020. The export of empty containers has soared dramatically as well - year-to-date August 2021, more than 2.6 Million TEU have been shipped empty out of the Port of Los Angeles - an increase of more than 60% year-over-year and about three times as many as laden exports. The vast majority of the empty containers are being returned back to Asia, just to return full as soon as possible.
Annual full and empty container exports January-August, Los Angeles and Long Beach
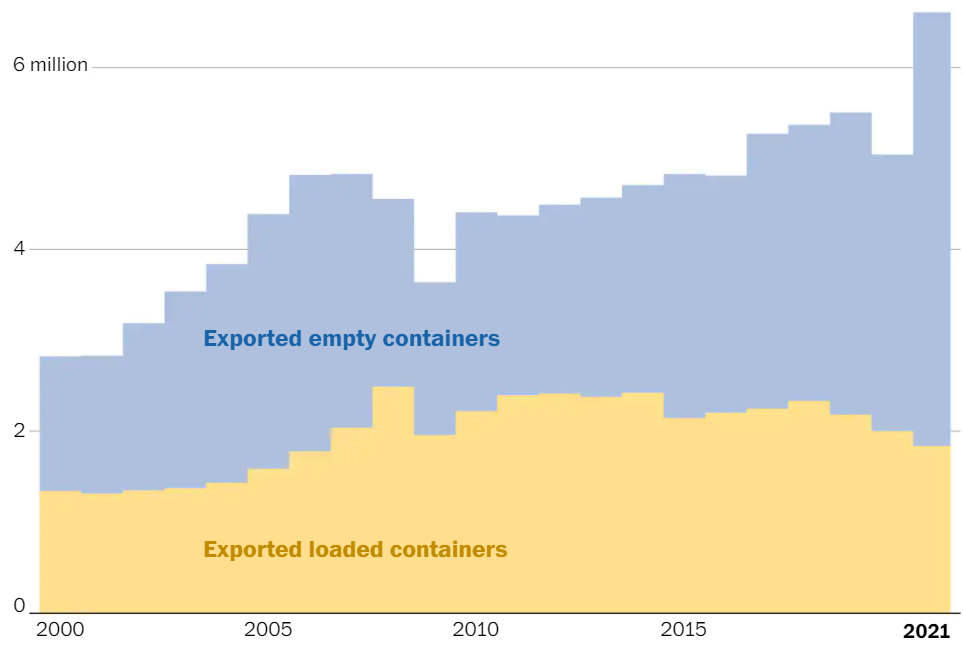 Source: The Washington Post, Ports of Los Angeles and Port of Long Beach
The Californian ports, handling about 40% of the imports into the US, are not alone in these trends. From the Southern states’ ports in the Gulf of Mexico, via Chicago in the North of the country to the East Coast, with New York/New Jersey or Savannah as examples for major bottlenecks: The whole US has developed into a dysfunctional supply chain situation, ranging from congested shores via a grid-locked port hinterland to heavily congested inland rail yards thousands of miles into the country.
The East Coast in particular has become severely problematic as it has been used by many shippers to mitigate the impacts from the disrupted West Coast. Congestion is growing significantly with, for example, more than twenty ships waiting off Savannah and dwell times along the East Coast having doubled quickly. The growth of volume throughput, as seen in West Coast ports, has been massive year to date. The recently published year-to-date August 2021 figures by Georgia Ports for example see Savannah’s laden imports year-over-year growth almost exactly the same as Los Angeles, at 31%.
The situation in the US in general has reached such a level that major importers have taken drastic measures to ensure an ongoing flow of supplies and products into the States. Companies such as Walmart, Target, Coca-Cola as well as Home Depot, Costco, Mattel and Ikea have chartered their own container or dry bulk vessels and also bought their own shipping containers in their efforts to mitigate the disruptions to their supply chains.
The massive growth of imports into the US together with the soaring exports of empties to be reused on the Transpacific Route ex Asia connects to the wider context for the global impact the United States’ supply chain situation has. As we have mentioned in our prior Connector, literally every ship that can carry containers is currently deployed and the massive orderbook of newbuilds that have been placed by various shipping lines will not begin to hit the water and hence ease the supply situation before the end of 2022. To satisfy the demand in the US and take advantage of the escalating freight rate levels, shipping lines were unable to add capacity into the US trades without removing it from other trades. As a result, capacity has become extremely tight on literally all other trade lanes. To maximise their utilization of equipment and minimize turn-around time in the ports, shipping lines have become extremely vigilant of the economic assessment of port calls to congested areas outside of the US in general – like, for example, the destinations mentioned in our above introduction.
Freight Rates
Spot rates from Asia to the US have increased to astronomical levels. According to Freigthos.com, in the first week of September the rate from China/East Asia to the West Coast of the US has reached the mark of 30,000 USD per container and from China/East Asia to the US East coast even close to 33,000 USD. This is almost double of the already extreme rate levels from Asia to Europe, where spot rates have settled around 18,000 USD, after they had reached levels of almost 25,000 USD per box in August. The average spot freight rate increase shows the dramatic development from a different angle: While Asia/Europe increased year-over-year by 670% in September, Asia/US East Coast grew by 480% and to US West Coast by 550%
But not only the trade connecting China to the US has seen massive rate increases. One of the most referred to indices, the SCFI (Shanghai Containerized Freight Index), published by the Shanghai Shipping Exchange, has seen a mostly uninterrupted increase since the end of April 2020. The rates for the trades in the assessed basket soared by 568% since the index started climbing.
SCFI (Shanghai Containerized Freight Index)
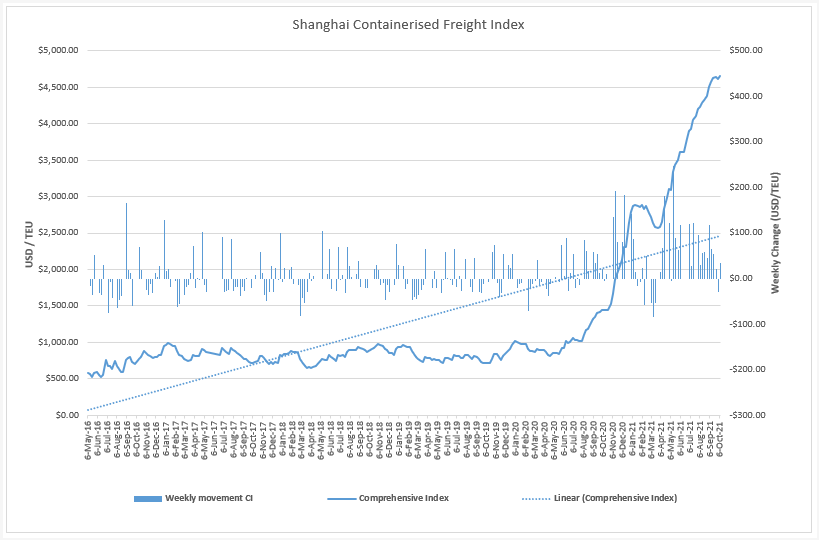 Source: SCFI, Bearing360
The global freight index by freigtos.com paints an even more dramatic picture in an even shorter review period. It increased by a massive 500% year-over-year, seeing the average spot rate in excess of 11,000 USD in mid-September 2021.
Global Container Index
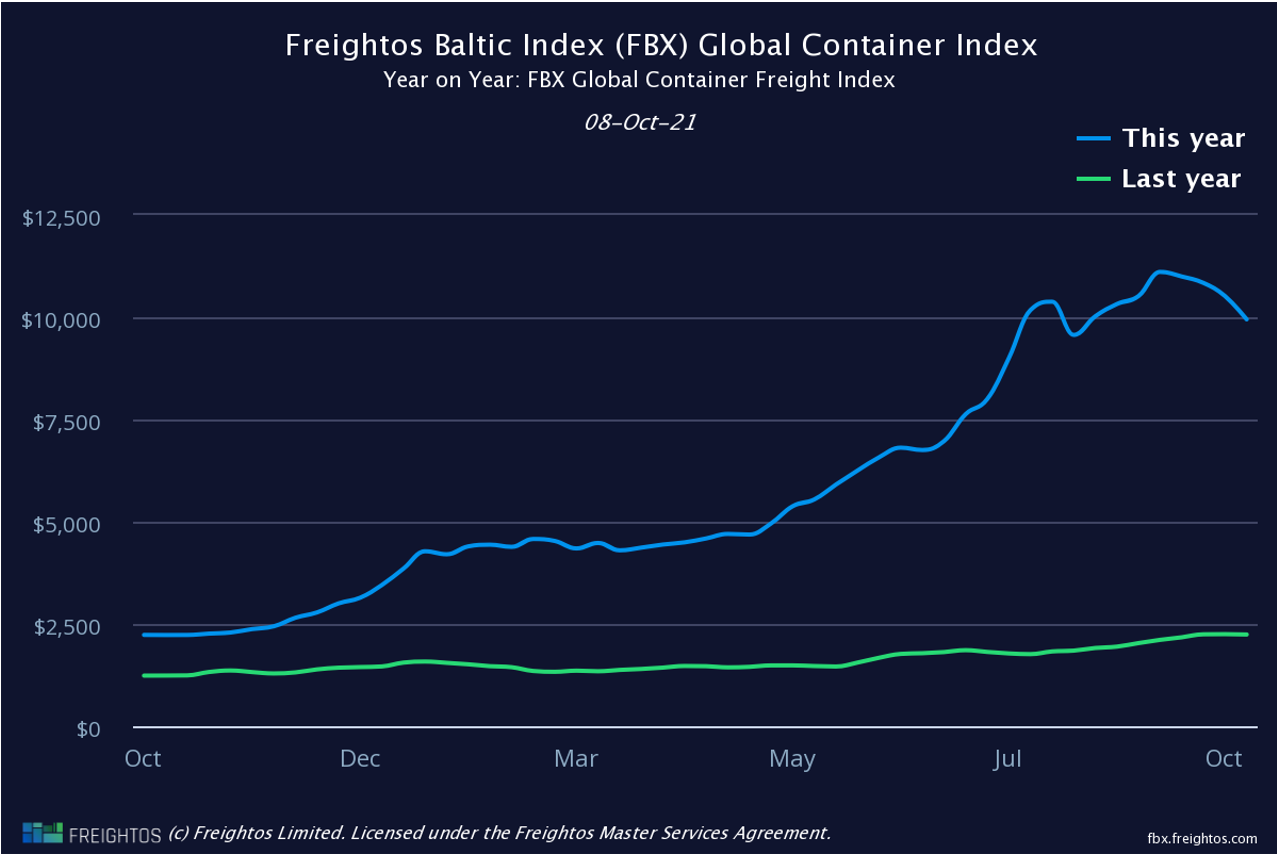 Source: freightos.com
As a consequence, the trades are competing for vessel deployment and equipment supply and shipping lines take radical decisions by switching off services, at times at very short notice, into congested areas and routes via congested transshipment hubs, to take advantage of all time rate highs and maximise profits. As shipping services connecting New Zealand to the world require transshipment in an operationally constrained Australia, or heavily congested ports in Asia to reach equally congested outports in South East Asia or India (as just two examples) we are exposed to cuts in the service offering or substantial rate increases – or both. At the same time, New Zealand customers across the board are being forced to accept drastically reduced service levels in the form of multiple rollings, largely unpredictable transit times or even plain deselection and cancellations.
The rate level increase, however, has not been limited to spot rates only. The benchmarking platform Xeneta recently reported that long-term contract rates on a global average skyrocketed by 91.5%. Furthermore, shipping lines have in the recent round of negotiations been able to secure rates at this level for even up to three years.
The long ongoing and continuing high rate level has meanwhile resulted in extraordinary profits for the shipping lines. Shipping consultant Drewry has recently upgraded its liner industry profit forecast to an “eye-watering” EBIT of USD 150 Billion, and further, looking into 2022, predicted even “slightly more again next year”. It is notable in this context that the previous forecast stood at USD 100 Billion – clear proof of how quickly, steeply, and yet continuously the freight rates have moved upwards, along with a strong profit-building support of a nearly countless number of introduced surcharges and rigorous enforcement of detention/demurrage charges as reported in our previous Connector.
Outlook
Connecting this profit projection to the spot freight rate development assumptions for the months ahead we expect rates to generally stay at historically high levels.
The underlying driver is and remains the ongoing global supply chain crisis and despite the assumption that the situation in the US has to improve at some point in time as a result of various measures taken by the ports and other players along the chain, we do not expect the operational context on a global scale to improve in the near future. After hopes had been high that the situation would normalise after Chinese New Year in February 2022, analyst Drewry has now stated in its recently published Container Forecaster, that “Supply chain turmoil will last longer than thought,” and that the problem is much deeper-seated than feared, with the pandemic bringing forward latent crisis within certain sectors.” The supply chain situation in the US as described above with its aggravating factors like driver shortage, lacking standardized real-time communication between the involved parties or an investment backlog in the ports and hinterland infrastructure, are just one example.
In New Zealand, we expect a continuously challenging environment as we deal with supply chain meltdowns in various areas around the globe. Mainly based on the influencing global factors discussed above, and further regionally connected to industrial actions in Australia, the fact that both countries are still gripped with the Covid-19 pandemic and the resulting impacts on the logistics operations and relevant workforce.
Overall, we expect the challenging environment for keeping Aotearoa connected to global markets to persist through 2022, with the potential of an improvement at least on a local and regional level along the way.
To avoid operational disruptions to your supply chains as much as possible, we would like to again ask you to place bookings as early and far in advance as possible in order to mitigate operational risks and build resilient inventory levels. Thank you for your co-operation and support. We would like to reassure you that our teams and our service providers are working tirelessly on solutions to provide you with the best possible customer service in order to keep the impact on your operations, and those of your customers as limited as possible.
Stay safe, and stay connected.