Connector Series - Container Freight Rates
Container Freight Rates
To understand the extent and impact the ongoing high container freight rate levels have it is inevitable to take note of the current and recent liner carrier financials. In 2019, the combined industry EBIT was at USD 6.5 billion and as such better than 2018 (USD 1.6bn) and on the same level as 2017 (5.4bn). The EBIT margin stood at 3.6%. After strong initial concerns when the pandemic started, 2020 turned out to be a very good year for container lines in terms of results. Combined EBIT stood at USD 26.1 billion, and the EBIT margin had seen a massive increase to 12.5%. In 2021, however, the projections for the full year had to be revised upwards repeatedly and eventually, with a combined industry EBIT of more than USD 200 billion and an EBIT margin of 45%, results reached levels far higher than any analyst had projected (at the beginning of 2021 most analysts were wondering if the industry can reach even the 100-billion-dollar mark. They very obviously could reach more than double that amount). But while these profits have widely been described as eye-watering, the 2022 result will most likely even top that, with the latest projection by Drewry sitting at USD 270 billion at an EBIT margin of 42%.
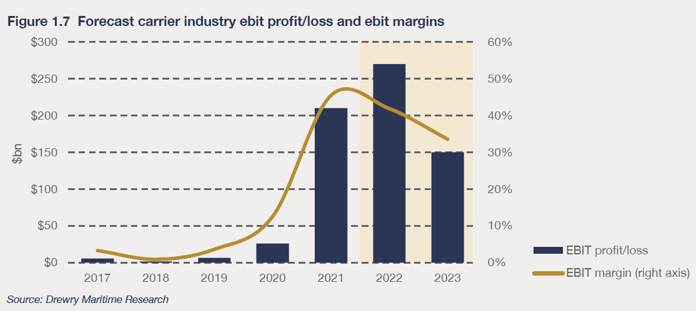
The projection of combined USD 150 billion and an EBIT margin closer to 30% even appears small compared to 2022 and 2021 but is obviously still easily rateable as “extremely profitable” and proof of the analysts’ assumption that the carriers have become very profit-aware and will likely be prepared to safeguard their profit streams with great effort: the freight rates.
These freight rates have reached astronomical levels in 2020, 2021 and 2022. The SCFI (Shanghai Containerized Freight Index), published by the Shanghai Shipping Exchange, for example, saw the rates rising by more than 600% from the start of the steep climb in 2020 until they peaked in the first quarter of 2022. The following graph shows the development of the SCFI spot rate index and with how much momentum the index broke through the USD 1,000/TEU threshold (and the following thousand-dollar thresholds) to skyrocket to more than USD 5,000/TEU.
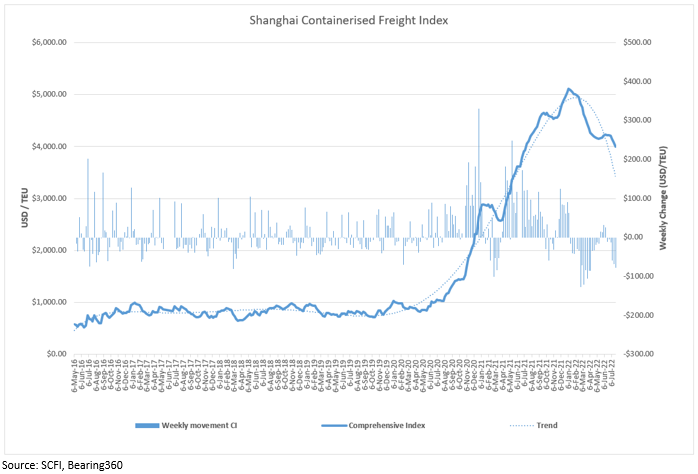
Early in 2022 spot rates started declining, mainly because of a steep drop in volume out of China as a combination of both a post Chinese New Year effect but more intensely due to China’s announcement and execution of comprehensive and strict lockdowns as an ongoing Covid-19 response. While the decline of spot rates has been steep for several months now, it is noteworthy that they are still 400% higher than pre-pandemic levels.
But while the spot rates declined, the contract rates kept rising. Only very recently market intelligence platform Xeneta reported the highest ever monthly increase in contracted ocean freight rates, with rates soaring by 30% vs April, bringing the year-over-year increase to more than 150%. An example of the two rate types developing in different directions can be seen in a chart published by Drewry’s Benchmarking Club, comparing spot and contract rates on East-West routes: While spot rates decline, contract rates continued to rise in 2022.
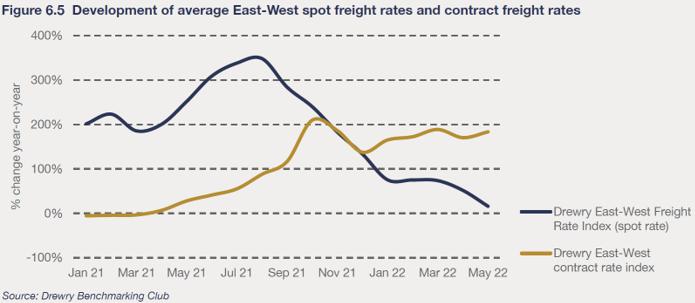
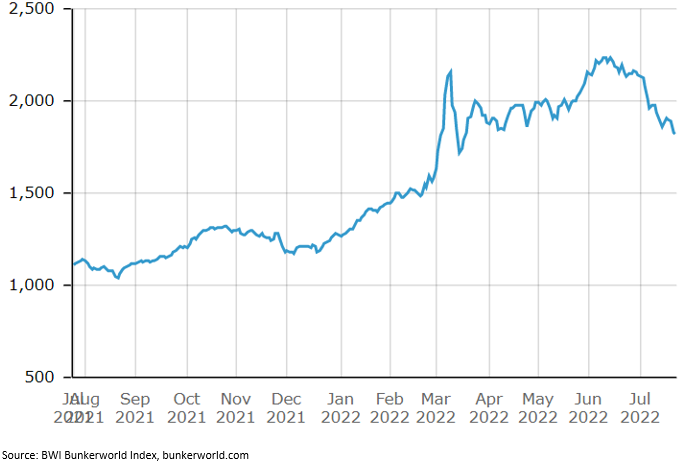
This difference in development stems from the nature, composition, and context of the two rate types: Spot rates are extremely market driven and in their pricing dynamics able to adjust to changing drivers almost in real time, such as seasonal patterns or, like in the above example, dramatic changes in the supply and demand scenario as a lockdown of Shanghai would trigger. Contract rates are far more driven by the timing of contract negotiations, securing strategic allocations across seasonal patterns or supply and demand changes. And, through their static base rates but connected BAF mechanisms, contract rates are far more strongly impacted by bunker costs. And these have been on a steep rise since Russia invaded Ukraine at the end of February 2022:
Furthermore, it must be taken into consideration where the two different rate types come from, since the above East-West example shows a percentage change. Spot rates were in stratospheric highs and as such they fall from an extremely high level. Contract rates have risen as well but at a different pace and mostly shipping lines were prepared to agree to substantial but compared to spot rates almost moderate increases in turn for longer contract periods from 3 months to 3 years.
Looked at together, spot rates on a decline and contract rates on an incline, approach each other to reach an overall annual freight rate level which marks still raising container freight rates compared to last year.
Next Chapter